November offer: EXTRA 30% off all courses & bundles. Use NOVEMBER30 at checkout. Ends 30 Nov.

Beyond Bank Reconciliation: Turn Your Bank Data into a Direct Cash Flow

Your bank reconciliation already holds a true direct cash flow. Get it out in 8 steps and use it to forecast cash with your own data.
Oct 21 / Peter Ilas, FCCA
Every month, finance teams reconcile their bank accounts, agree the balance to the bank statement and move on. The balance is right. But the most useful information in the account stays unused: what came in, what went out, to whom and when.

The short answer

Categorize every bank and cash transaction by its contra account, and you get a direct cash flow from bank data that is true and exact: real receipts and payments by category, month by month. Its main use is forecasting with the payment patterns of your own business instead of guesses. The categories also make errors (and even some fraud patterns) visible early. You don't need new software or coding skills, just clean data, clear categories and a tool that repeats the work every month.

Why a reconciled balance is not enough

A bank reconciliation is like a photo taken on the last day of each month. It answers one question: is the closing balance right? It does not tell you what moved it.

When I reconciled accounts myself, I did not care whether the balance was large or small, healthy or dangerous. It agreed, and that was what mattered.

Later, as EMEA Balance Sheet Review and Reconciliation Manager at Dell, I set up a department that reviewed reconciliations and their quality. We reviewed thousands of them across the region. We assessed what each one told the manager who reviewed it. They came in three kinds:

  1. The balance agrees to the bank statement. Correct, but it says nothing more.
  2. The difference is explained, for example by timing between the posting and the cash movement.
  3. The difference is not explained. The manager can only ask for a follow-up.
I saw thousands of reconciliations. Very few gave the reviewing manager information for a decision.
Peter Ilas, FCCA
former EMEA Balance Sheet Review and Reconciliation Manager, Dell
Most companies reconcile because the law or their auditors require it. When a big unexplained difference appears, it gets attention until it is resolved. Few go to the next level: a review that tells the manager what the movements mean for their decisions.

What the indirect method does not show

Most companies prepare their cash flow statement with the indirect method: start with profit, add back non-cash items, adjust for working capital. It explains why profit and cash differ, but not who paid you, whom you paid, or when.

IAS 7 encourages the direct method because it "provides information which may be useful in estimating future cash flows and which is not available under the indirect method" (IAS 7, paragraph 19). US GAAP encourages it too (ASC 230-10-45-25). Still, few companies use it, because collecting gross receipts and payments by category looks like extra work.

You can keep the indirect method for reporting. To manage cash, you still need this month's receipts from customers and refunds, which are easy to agree to the P&L, and the payments for supplier invoices, payroll, operating costs, investments, fees and taxes. They explain why cash fell again this month.

It is less work than it looks. In the bank account, almost every line is real cash. The receipts and payments are already there; only the category is missing.

The method: categorize bank transactions by contra account

Every bank posting has a contra account: the other side of the journal entry. This is the key: it already contains an accounting decision about what the payment or receipt was for, so you don't have to guess from the bank text.
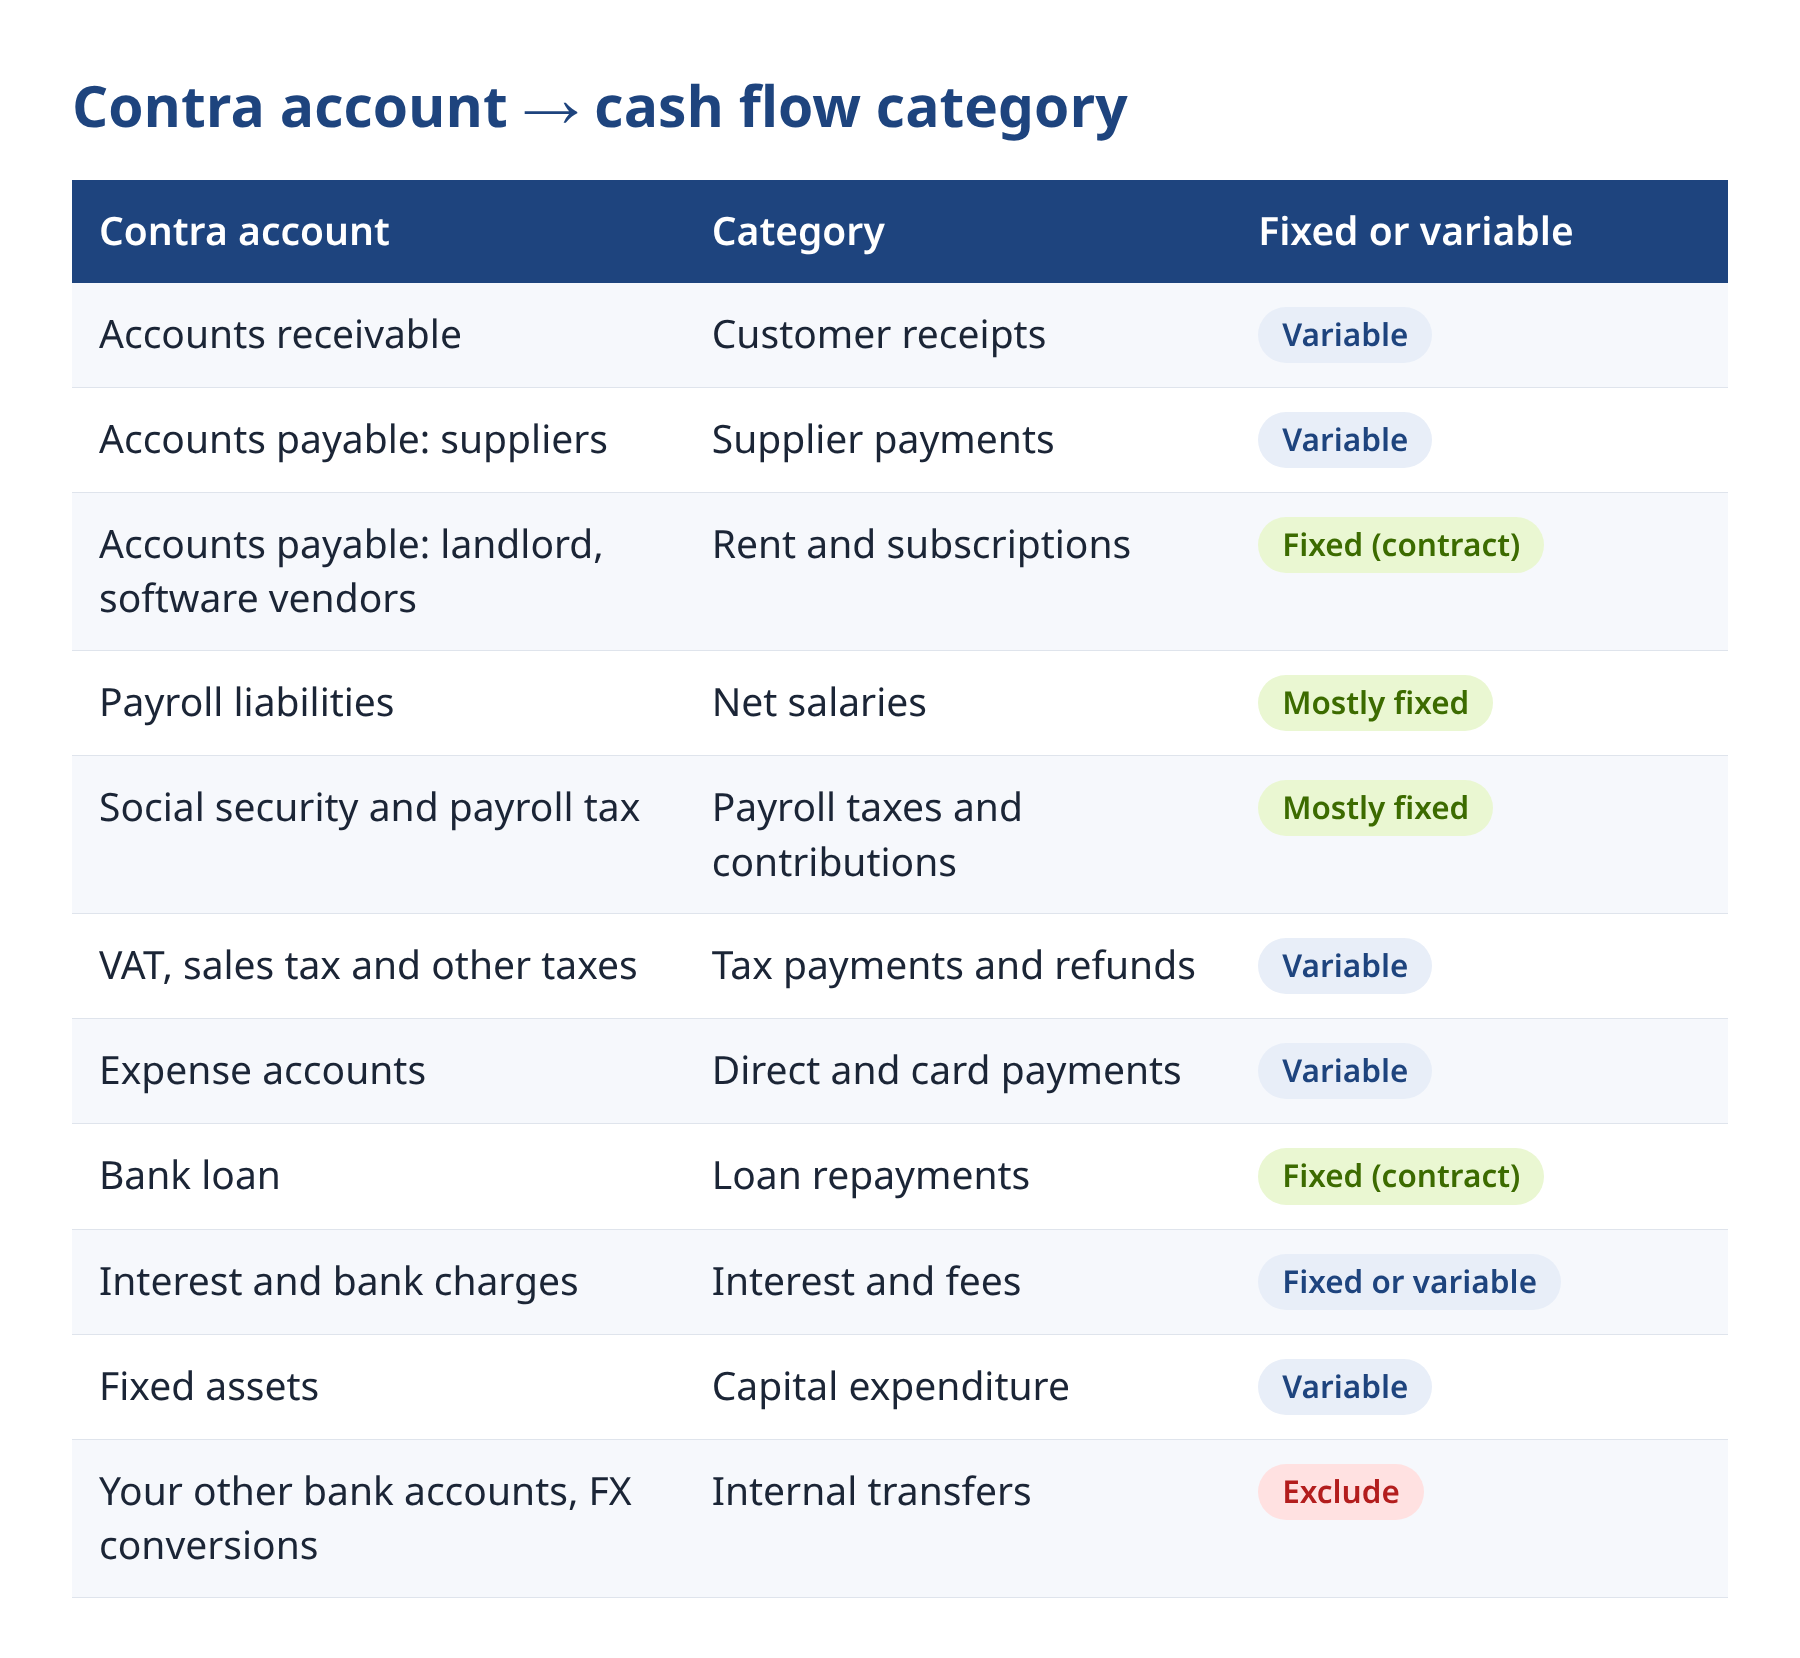
Contra accounts mapped to cash flow categories
Two practical points. When one contra account holds different flows, refine by counterparty or contract: in accounts payable, suppliers, the landlord and software subscriptions sit together. And map each category to operating, investing or financing activities, so the same data supports your cash flow statement.

Example: one bank loan, two reconciliations
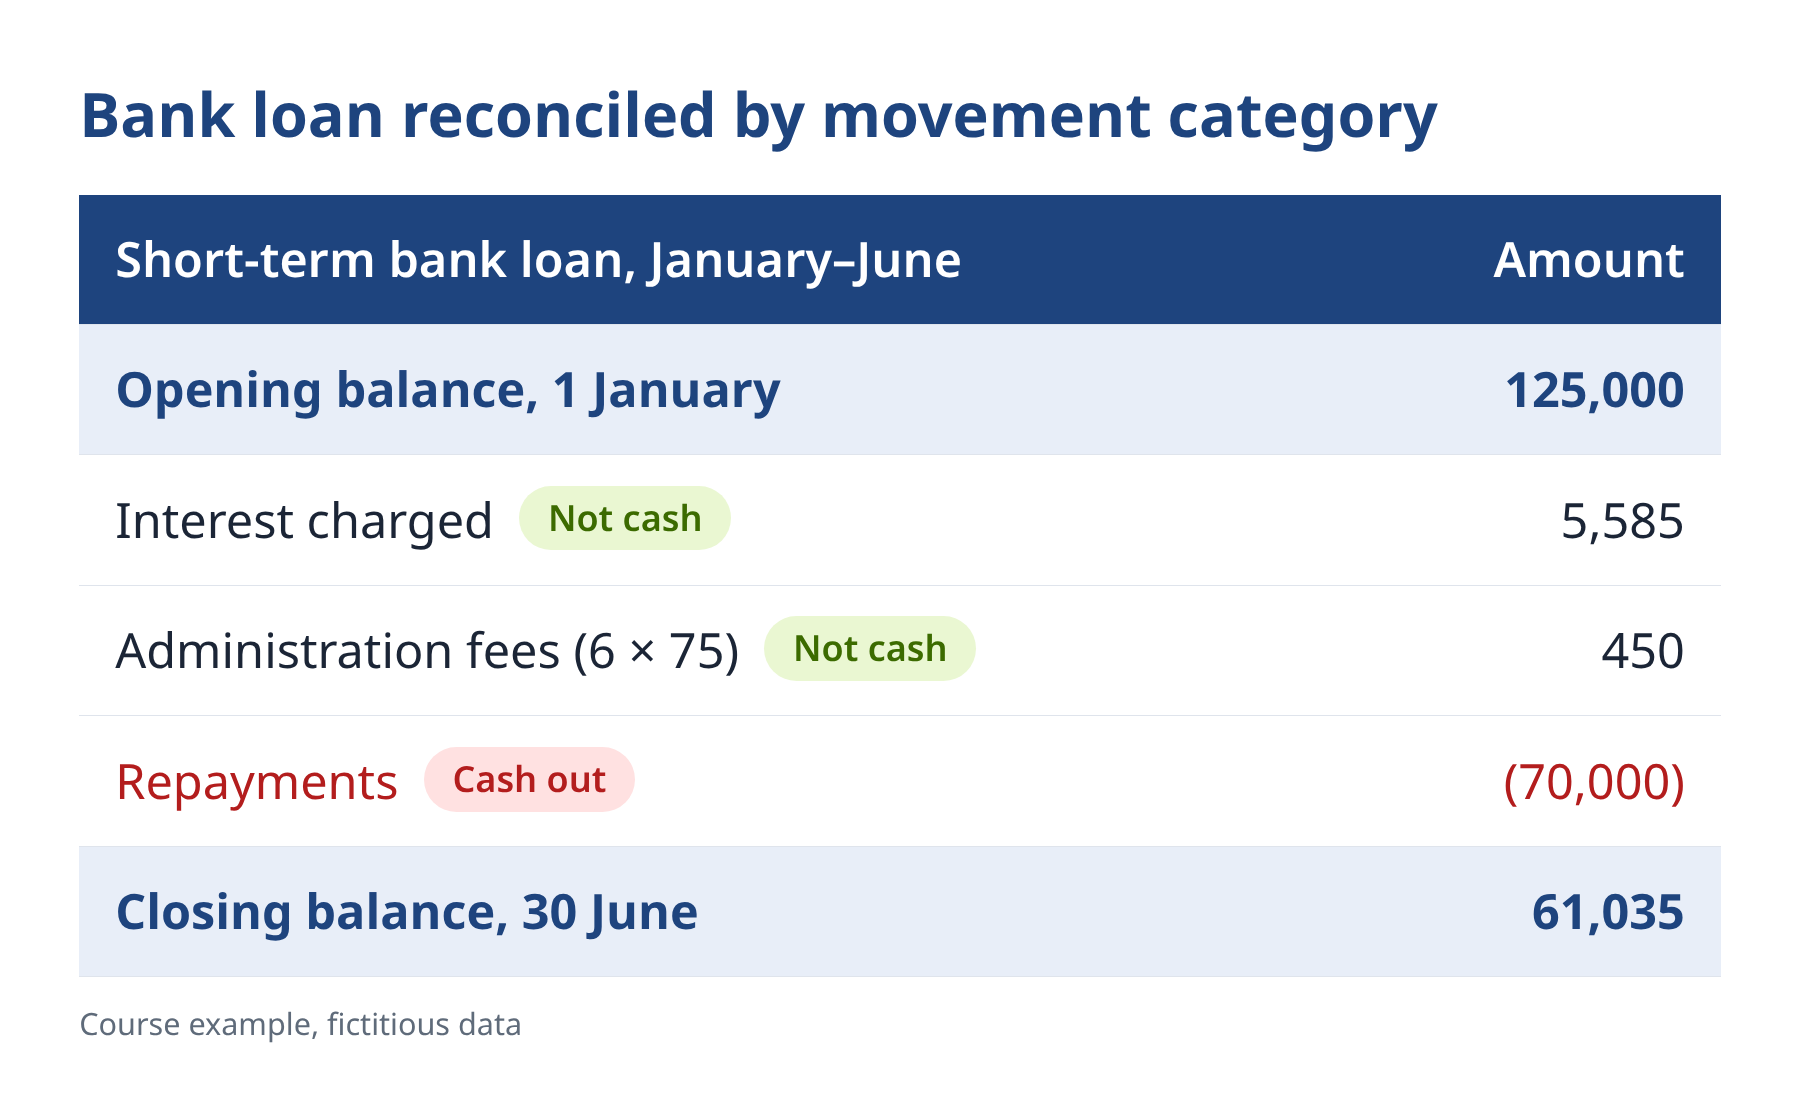
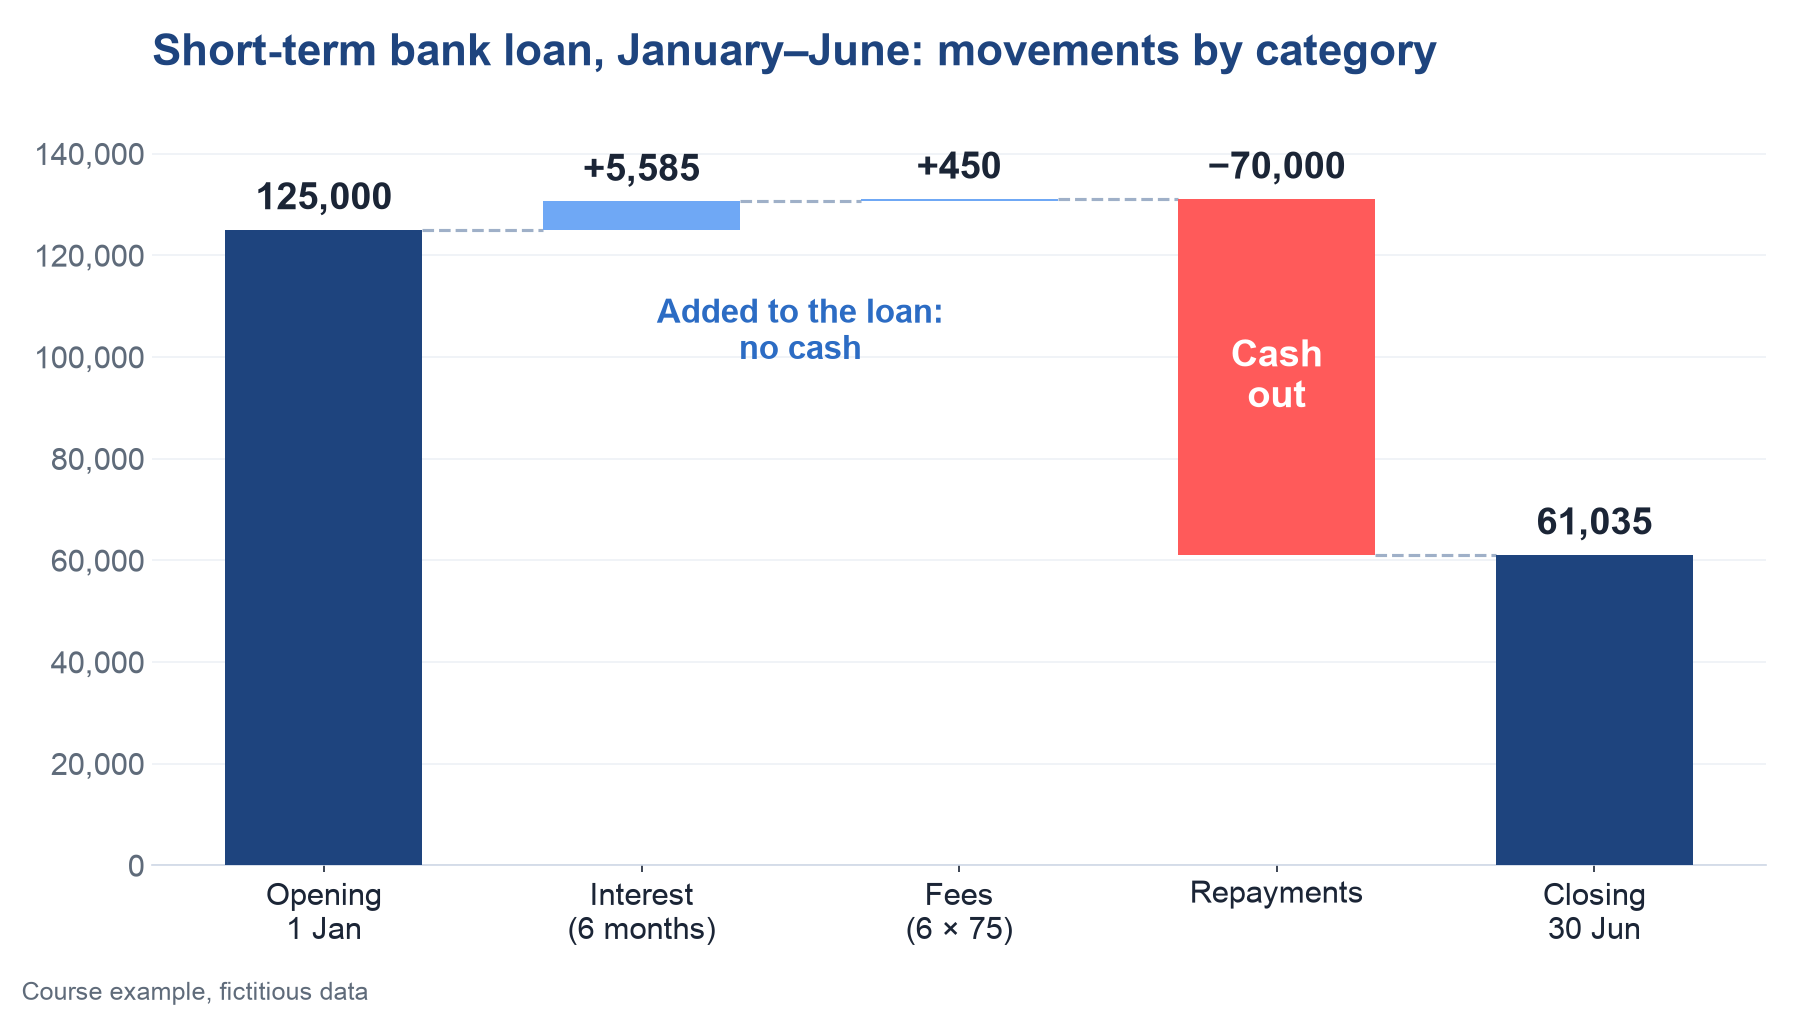
In one lesson of my course, I reconcile a short-term bank loan for January to June in two ways. Every month, the account has three movements: interest, an administration fee of 75 and a repayment.

The descriptions don't help. Three lines say only "Monthly loan posting", and one fee has no partner, so sorting by text fails. Sorting by account works: interest and fees are posted against two different expense accounts, and the repayments against the bank.
Bank loan table: opening balance, interest and fees (not cash), repayments (cash out) and closing balance
Bank loan reconciliation by movement category
Only the repayments were cash; interest and fees were added to the loan
The first approach agrees the closing balance to the bank's loan statement: quick and correct. The second reconciles the opening balance, the movements by category and the closing balance. It shows that the only cash outflow was 70,000 of repayments, because interest and fees were added to the loan, and that interest fell from 1,250 in January to 650 in June. Setting it up takes minutes. In July, you add three new journals to their groups, check them to the statement and close.

From bank lines to a direct cash flow in 8 steps
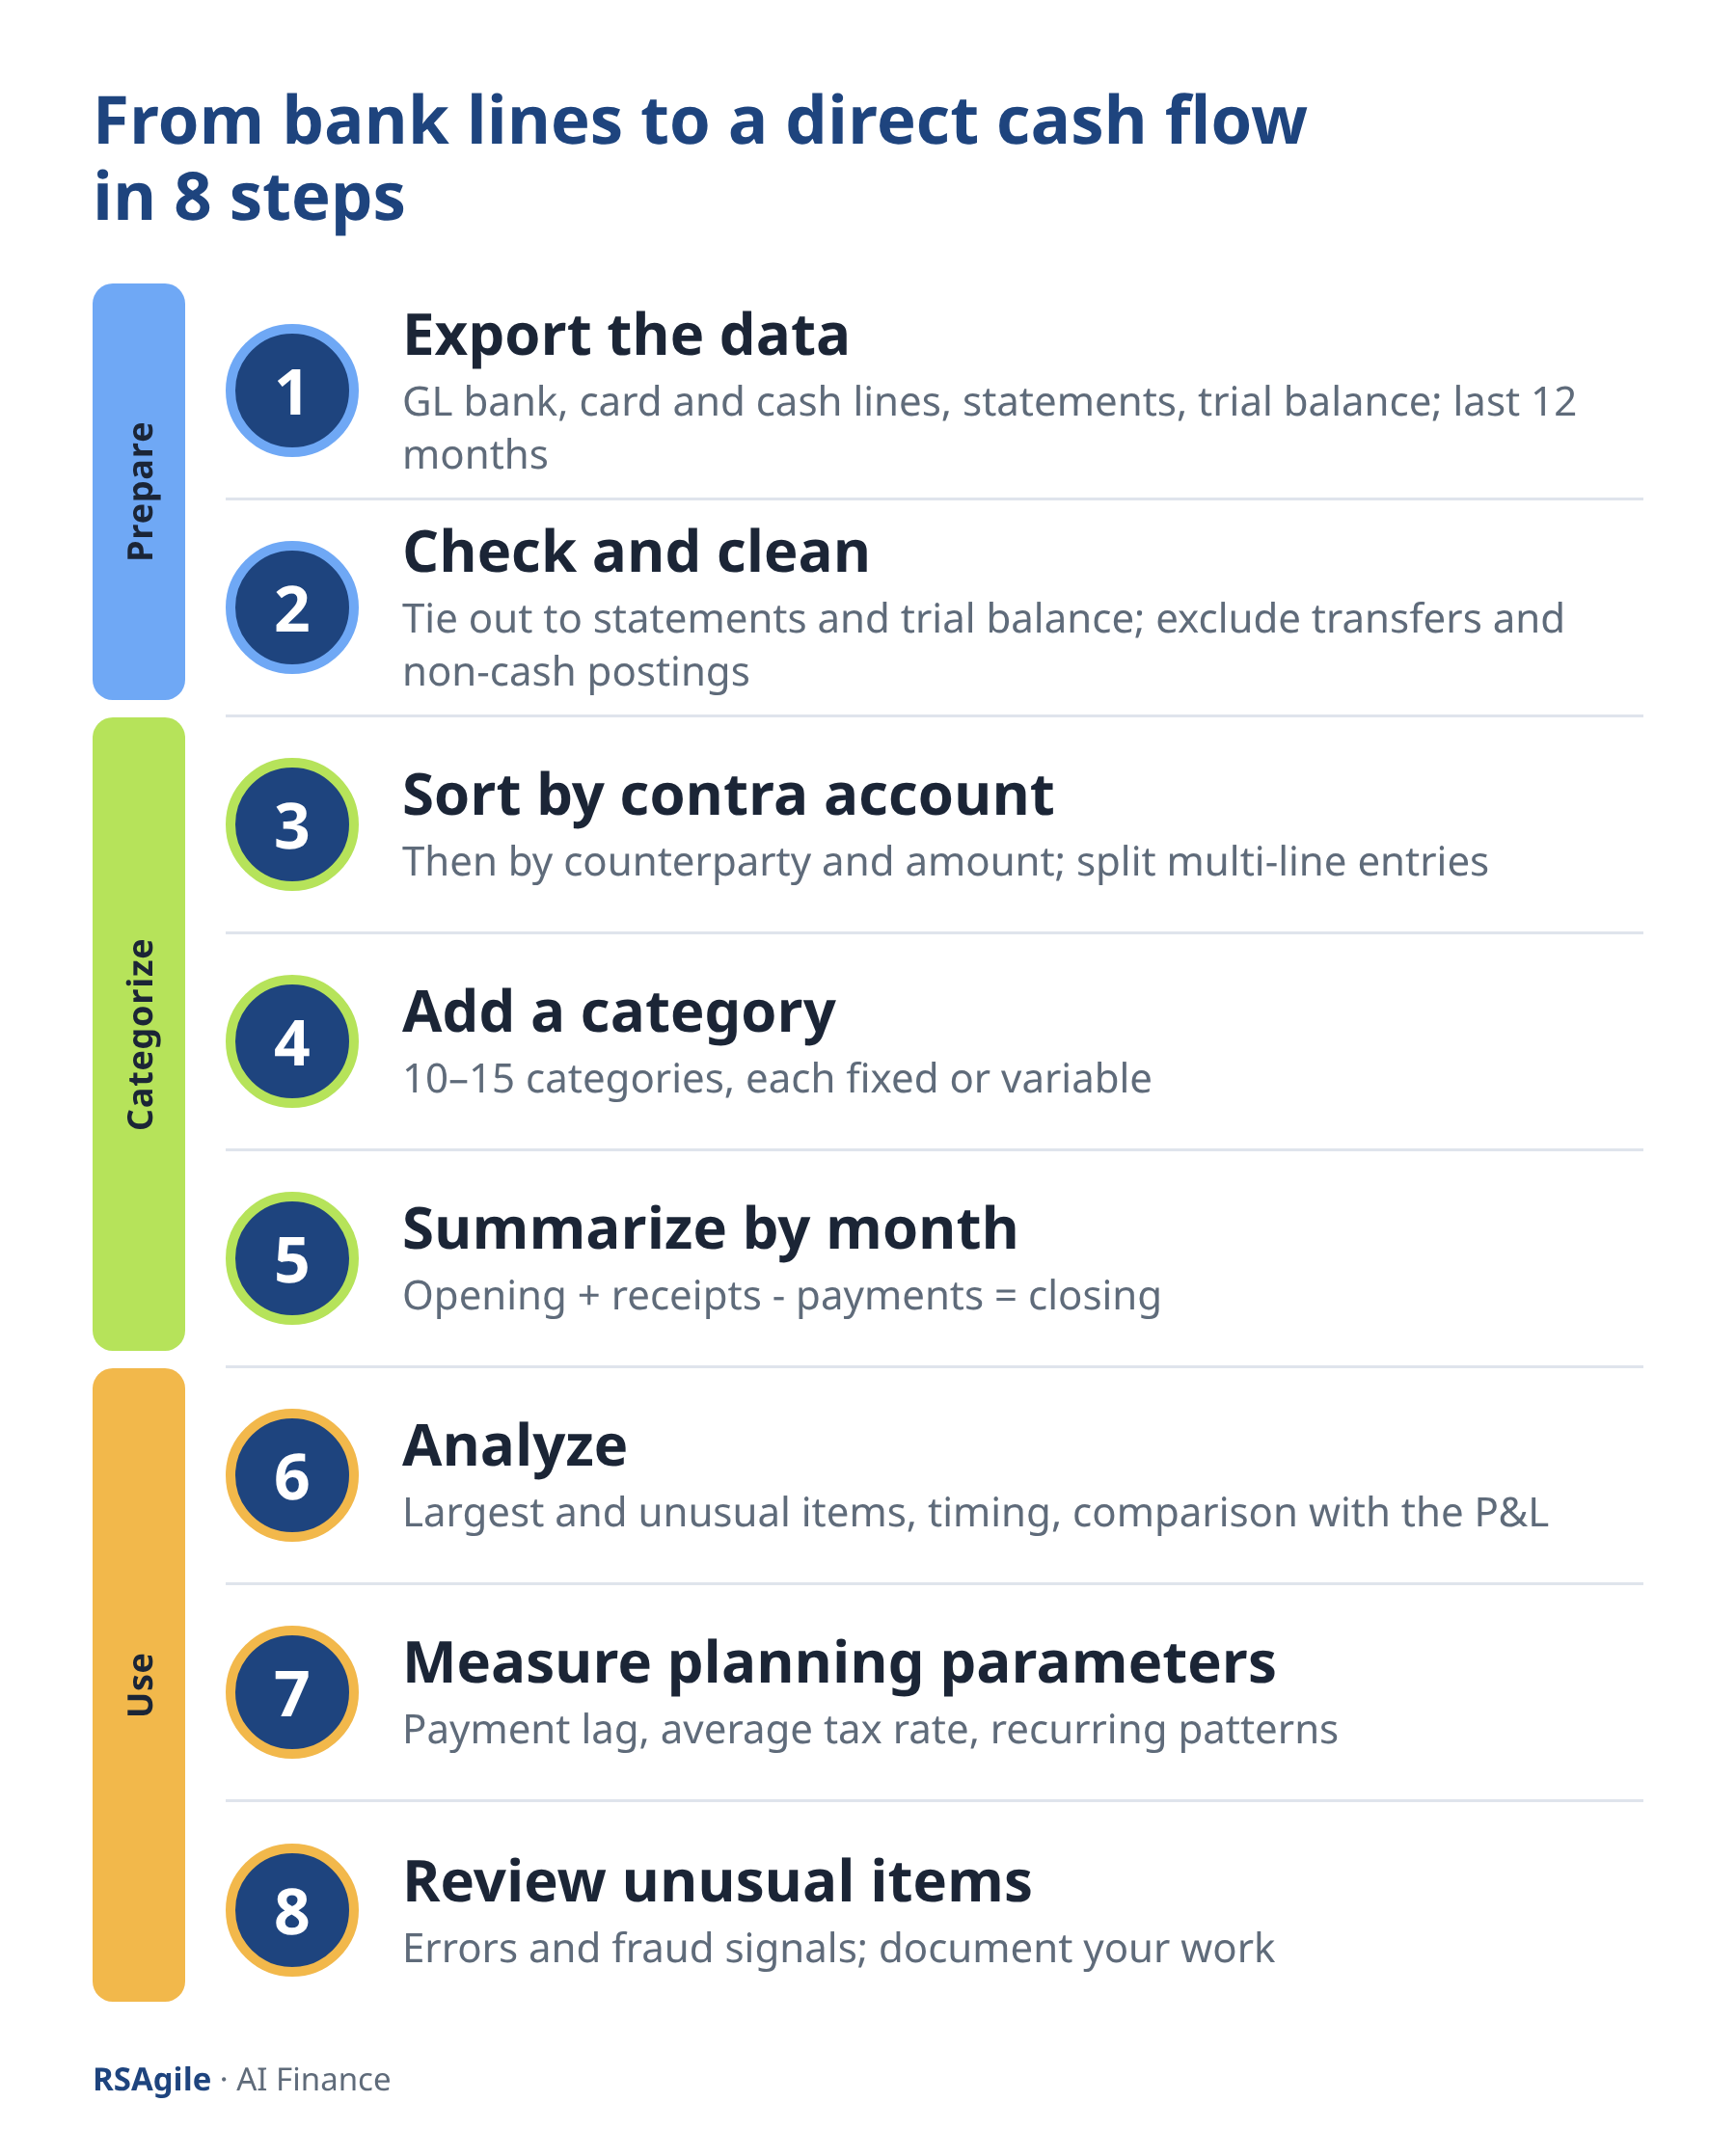
8 steps from bank lines to a direct cash flow
From bank lines to a direct cash flow
  1. Export the data. General ledger lines of all bank, card and cash accounts, with contra account, counterparty, description and transaction date, plus the bank statements and the trial balance. Start with the last 12 months.
  2. Check and clean. Agree the balances to the bank statements and the journals to the trial balance turnovers. Take out transfers between your own accounts, FX conversions and non-cash postings such as FX revaluation, otherwise receipts and payments are overstated.
  3. Sort by contra account. Then by counterparty and amount where one contra account holds different flows. If one bank line has several contra lines, split it.
  4. Add a category. Ten to fifteen categories are enough for most companies. Mark each one as fixed or variable.
  5. Summarize by month. This is your direct cash flow. Check that the opening balance plus receipts minus payments equals the closing balance.
  6. Analyze. Review the largest and unusual items, the timing, and each category against its revenue or expense line in the P&L.
  7. Measure your planning parameters. Payment lag, tax rate and recurring patterns (see the next section).
  8. Review unusual items. Look for errors and fraud signals. Document what you checked and what you found.

After the first month, the routine is short: load only the new journals, tie them out to the trial balance and let your mapping categorize most lines. You review the new counterparties and the small "other" group.

From history to forecast: three parameters from your own data

The P&L shows when revenue is earned and costs are incurred; the bank shows when cash moves. Three things sit between them, and your categorized history measures each one. Fixed flows such as salaries, rent and loan repayments come from contracts and payroll.

1. Timing

Customers pay 30, 45 or 60 days after the invoice; you pay suppliers in payment runs. With stable sales all year, timing changes little, so I personally don't model it in detail. In seasonal months or fast growth, I apply the collection days (DSO) and payment days measured in the history, because then every month of delay moves a lot of cash.

2. VAT and other taxes

Receipts and payments include VAT or sales tax; the P&L does not. The tax is collected, paid and settled with the tax office, so I keep it simple: an average rate on revenue and on purchases, plus the monthly settlement. If most transactions carry the standard rate, I use it. If not, I compare 6–12 months of payments with the P&L, because payroll, interest and some other costs carry no tax.
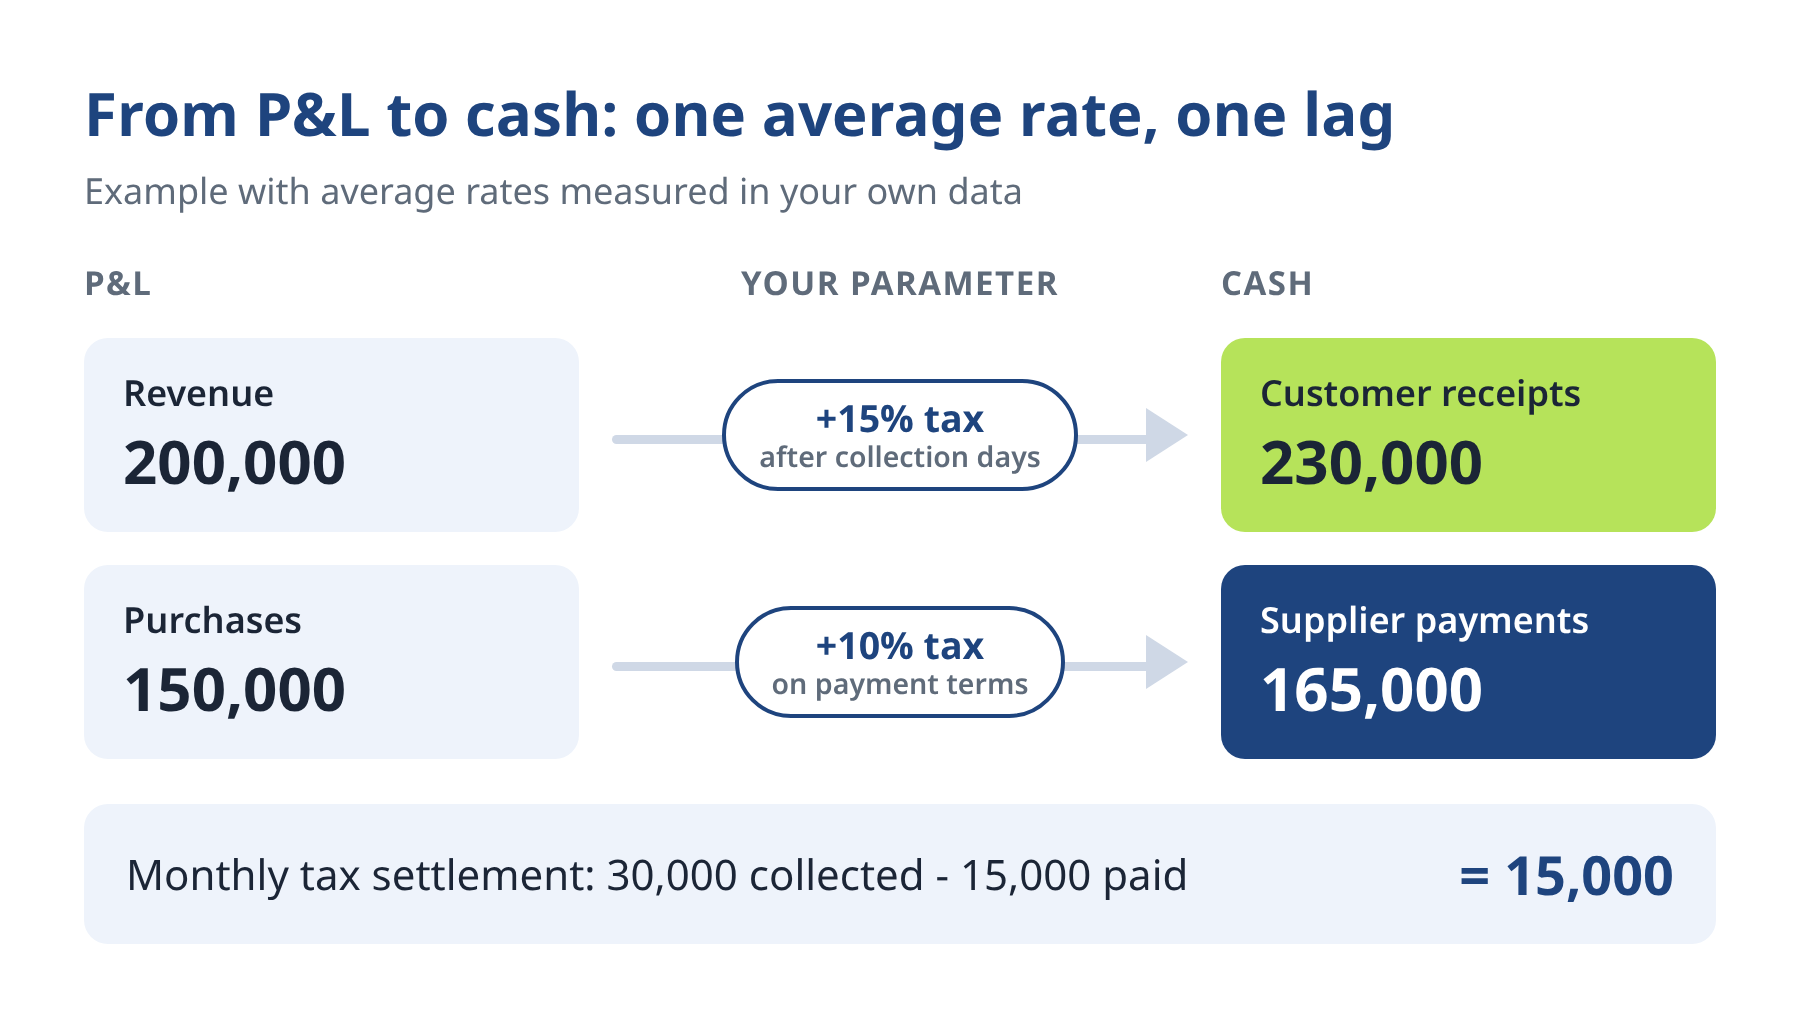
From P&L to cash with average tax rates and a monthly tax settlement
Average tax rates measured in your own data
For example, with average rates of 15% on revenue and 10% on purchases:
  • Revenue of 200,000 becomes receipts of 230,000, after your collection days.
  • Purchases of 150,000 become payments of 165,000, on your payment terms.
  • The tax settlement: 30,000 collected minus 15,000 paid = 15,000.

3. Patterns

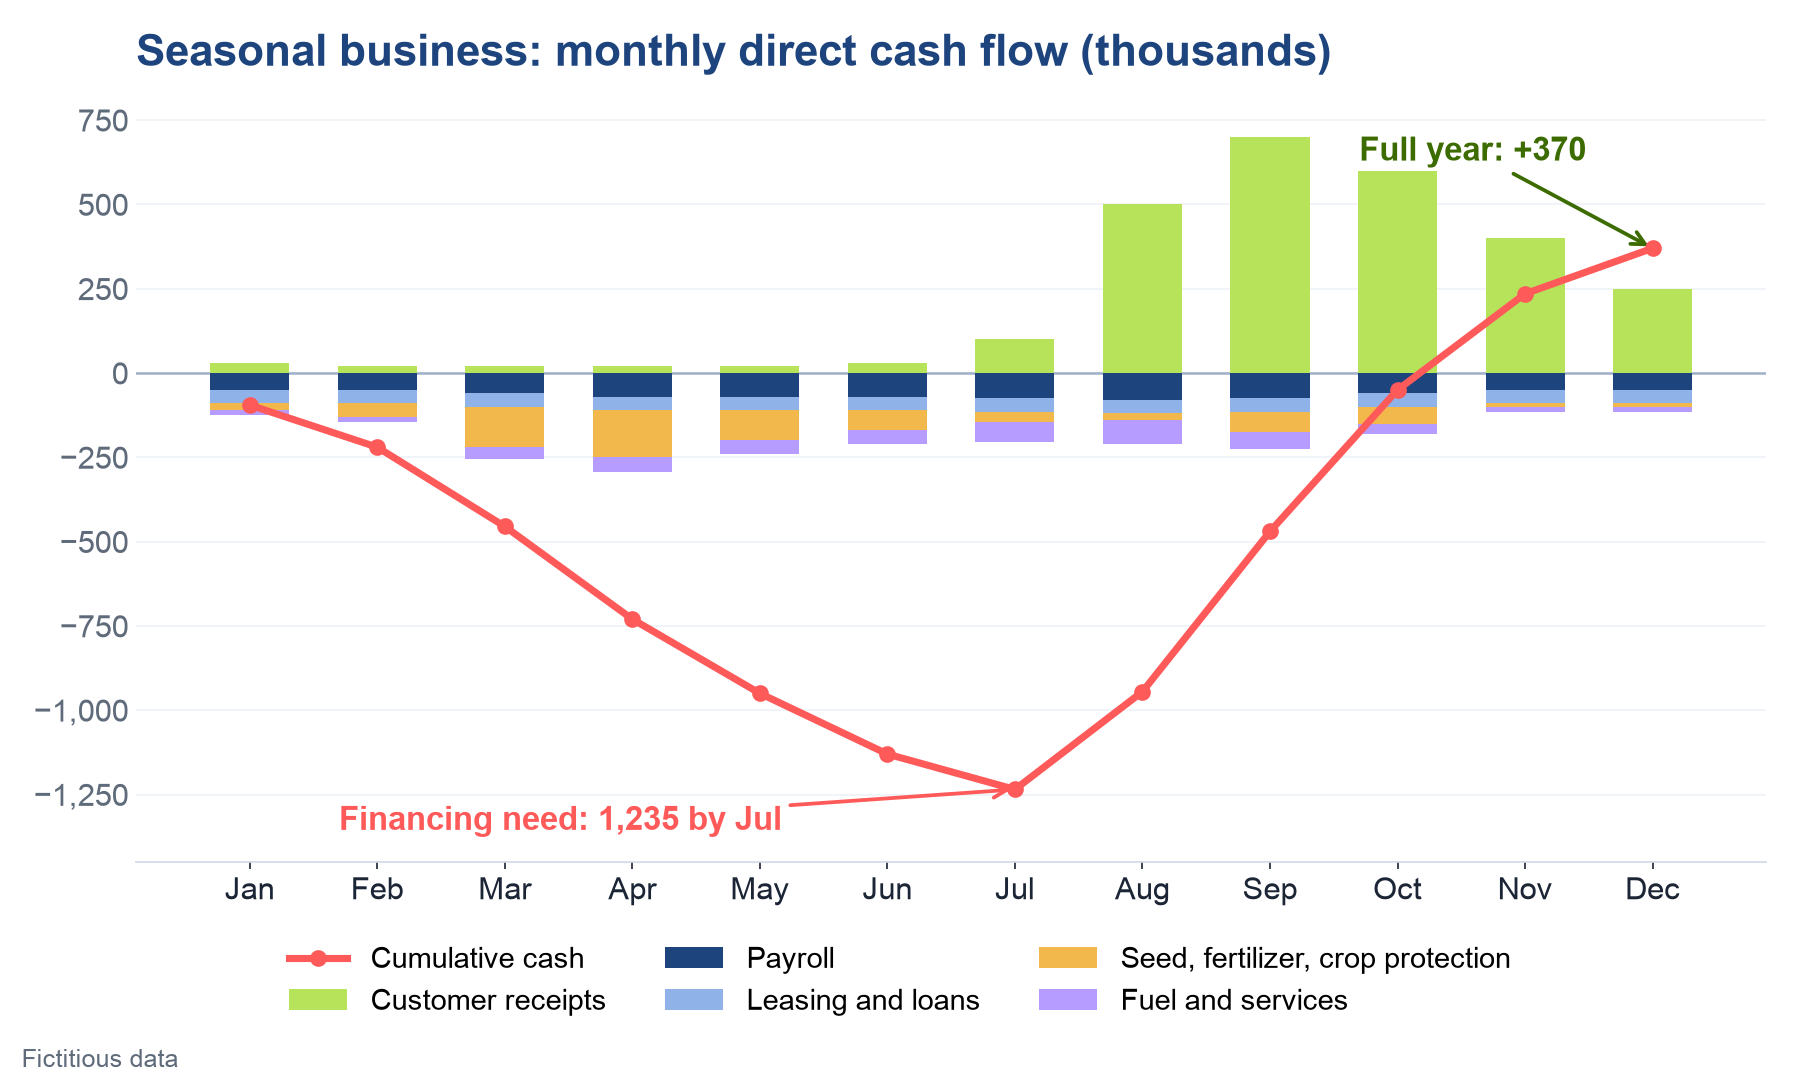
Bulk payments, quarterly rent, annual insurance and customers who always pay late all show up in the categories. Seasonality is the biggest pattern. One of my clients works in agriculture. From January to August, cash goes out on payroll and leasing in fixed amounts, while seed, fertilizer, crop protection, fuel and services come with longer payment terms (this is the industry practice). Cash from sales starts in August. The full-year P&L forecast looked healthy, but financing the first eight months was the real challenge — only the cash flow forecast revealed it.
Monthly direct cash flow of a seasonal business with cumulative cash
A seasonal business: profitable over the year, short of cash until autumn (fictitious data)

Keep it simple

A P&L forecast is never precise, and a cash flow forecast even less so, especially when you compare scenarios. A few parameters calculated from your own data (an average tax rate, a payment lag, the seasonal pattern) beat estimates without data, which are unreliable, and complex calculations nobody maintains. Your forecast becomes a calculation you can explain to your CFO, bank or auditor. Compare it with the actual every month.

What else the categories reveal: errors and fraud signals

Once each line has a category, unusual items stand out: an amount far outside the usual range, a payment outside the payment run, a category growing faster than its P&L line, a new counterparty receiving large or round amounts.

Most will be normal transactions, such as more purchases from a new vendor for a new project. Some will reveal an error, such as a wrong contra account or a posting in the wrong period. A few could be deliberate fraud. In the ACFE's 2026 Report to the Nations, asset misappropriation appeared in 90% of the 2,402 cases studied, and a typical fraud ran for 12 months before it was detected (ACFE, 2026). In my experience, fraud nearly always ends with cash leaving the company or never arriving. That makes your bank data one of the best places to look.

A red flag is not proof. Check the documents, keep a record of your work and follow your company's policy if you suspect fraud. To test invoices, payments, approvals and vendor bank accounts for 24 fraud patterns, see Build Your AP Billing Fraud Dashboard.

Where AI fits, and where your judgment stays in charge

Excel is a great, flexible tool for a one-off analysis. Every month, though, you load new data, sort it again and try to keep groups of lines together. Formulas don't follow large, changing data, and there is no workflow to process and check each new month. That is one reason why so few reconciliations I reviewed told the manager anything.

You don't need to code to fix this. In my course, you build a reconciliation tool with AI (ChatGPT, Copilot, Gemini, Claude or any other) by describing what you need in plain English. The finished tool is a single HTML file that runs locally in your browser. Each month it loads only the new journals, ties them out to the trial balance, skips lines already loaded and preserves your groups and statuses.

AI can also suggest a category mapping from your account names, list outliers and draft a commentary. You decide the categories, what counts as unusual and what needs a closer look. The AI is the builder; you are the decision-maker.

Data safety comes first. When I recently discussed offering these AI-built tools with my business partner, his first question was whether they were safe, because client data must be protected. He was right to ask. The course covers data safety step by step, so you work within data privacy rules and your company's policies.

Key takeaways

  • A reconciled balance tells you the number is right, not what moved it.
  • Categorize bank and cash lines by contra account to get a true direct cash flow.
  • Tie out to the trial balance first, and exclude transfers and non-cash postings.
  • Forecast with a few parameters from your own data: payment lag, average tax rate and seasonal patterns.
  • Most unusual items are normal, some are errors and a few may be fraud. Check, document and escalate.

FAQ

Is this the same as the direct method under IFRS or US GAAP?

It is the management version. If you map the categories to operating, investing and financing activities, the same data supports your statutory cash flow statement under IAS 7 or US GAAP.

How much history do I need?

Start with the last 12 months. Add the previous year if your business is seasonal.

Can I do this in Excel?

For a one-off exercise, yes, but sorting groups of items is hard and you need many checks. For several accounts every month, a tool that remembers your mapping saves time and avoids errors.

Does it work with several currencies?

Yes. Use amounts in your reporting currency at the transaction rate, and keep FX revaluation out of the cash flow, because it is not a real cash movement.

Build your own tool

In AI Finance: Build Your Automated Reconciliation Tool, you build your own reconciliation tool with AI, without coding, and reconcile a bank loan both ways, step by step.
9.5 CPE credits, 5.5 hours of video in 60 lessons.

Peter Ilas, FCCA

Founder, RSAgile | E-LITE Consulting
30 years in finance, accounting, audit and internal controls.
Builds practical AI tools for finance teams.
Created with